Categories
- Channel Analytics
- Inside Discover
- Marketing Integration
- Migration
- Omniture Business
- Online Marketing
- Online Merchandising
- Search Engine Marketing
- SEO
- Site Search
- Social Media
- Testing and Targeting
- Web 2.0
- Web Analytics
Authors
- Aseem Chandra (3)
- Adam Egbert (6)
- Adam Greco (46)
- Alex Hill
- Adam Justis (2)
- Brent Dykes (35)
- Nate Smith
- Ben Gaines (52)
- Brig Graff (5)
- Bret Gundersen (4)
- Brandon Hartness (2)
- Brian Hawkins (4)
- Brent Hieggelke (6)
- Bill Mungovan (16)
- Ben Robison (8)
- Brent Watson (7)
- Cameron Cowan (4)
- Chad Greenleaf (2)
- Chad Warren (3)
- Chris Haleua
- Chris Knoch (4)
- Christopher Parkin (18)
- Christian Ridge (2)
- Customer Success (21)
- Chris Zaharias (6)
- David Humpherys (2)
- David Kirschner (5)
- Ed Hewett (19)
- Eric Hansen
- Harrison Jenkins
- Jacob Favre
- Jeremy Anderson (1)
- John Bates
- John Broady (10)
- Josh James
- Jordan LeBaron (5)
- Jim McTiernan (2)
- Jeff Minich (9)
- Jose Santa Ana (2)
- Justin Grover (6)
- Kiran Kairab Ferrandino (8)
- Kevin Lindsay (5)
- Karl Moats
- Kevin Willeitner (4)
- Laura MacTaggart (5)
- Matt Freestone (1)
- Matt Belkin (35)
- Mikel Chertudi (12)
- Melinda Kersey
- Michael Halbrook (10)
- Michael Klein (4)
- Matt Langie (6)
- Marianne Llewellyn (2)
- Meme Rasmussen (1)
- Neil Morgan (6)
- Natalie Lacuesta Byrum (1)
- Pearce Aurigemma (29)
- Raj Sen
- Ray Pun (9)
- Richard Carey
- Roger Woods (2)
- Rich Page (1)
- Siddharth Chaudhary (2)
- Steve Gustavson (3)
- Steve Hammond
- Tamara Gaffney (3)
- Tim Lott
- Tim Waddell (5)
- Wes Funk (4)
Pages
Recent posts
- Adobe SocialAnalytics European Launch Roadshow
- Finding Online Success through Powerful Testing and Optimization
- Put your customers in the driver’s seat with customization
- Think Targeted Merchandising as You Head into Holiday Selling Mode
- iOS App Measurement Updates for iOS 5 and UDID
- A Thousand Points of Insight Part Three: Adobe Genesis 3.0 Unveiled
- Wrangle Your Tags with Adobe TagManager
- A Thousand Points of Insight, Part Two
- Are You Using Web Analytics To Power & Improve Your Testing?
- B2B Emailers have a T-Rex problem
Recent comments
- Ameer: I was trying to track…
- Toner online: This is an imp…
- Bret Gundersen: Scott, we ar…
- avril redmond: is theire any…
- Scott Calise: I just want to…
- Jorgen Sorensen: @Chris - I …
- Chris: Thanks for the heads-…
- Clubmz Reviews: Eventually i…
- srilakshmi: Hi, recently …
- Tad Miller: Seeing 19% of Go…
Links
- DigitalAlex
- eMetrics (Jim Sterne)
- Forrester Research (John Lovett)
- Future Now’s grokdotcom
- immeria
- June Dershewitz on Web Analytics
- Lies, Damned Lies
- LunaMetrics
- Mine That Data
- Occam’s Razor
- Rich Page Ramblings
- SemAngel
- The Analytics Guru
- The Omni Man
- Web Analysis, Behavioral Targeting and Advertising
- Web Analytics World
Archives
5 Helpful Discover Tips
Do you want to be able to get to the data you need more quickly in Discover? Below are 5 tips to save you time as you discover more information about your visitors and opportunities to enhance your site.
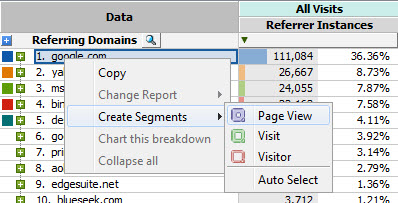
1. Quick segment creation
Often I find myself looking at a report in Discover and I think that a particular value in a report is interesting, interesting enough for me to want to dig deeper, which requires me creating a segment. Instead of going to the segment builder from the left menu, you can create the segment from within the report itself. Just right click on the value and you get a menu like the screen shot blow. Once you select which container you want to use, Discover creates the segment and automatically places it in the report that you are in. You can then right click on the segment to save it if you want to keep it for future use.
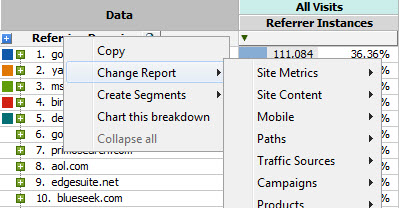
2. Quick report change
I compare segments, a lot. When comparing segments it takes a little bit of time to get the report set up exactly like I want it with the right segments. Instead of having to go through the same process for all the other reports you want to view you can change a report with the right click of your mouse. Just right click on the report name and go to Change Report and you will see the reports menu. If you want to keep your original report you can copy the report first and then perform this modification on the copy.
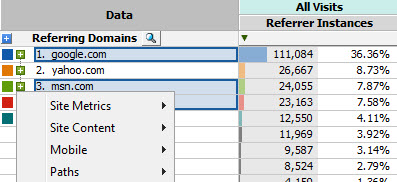
3. Breaking down more than one row at a time
You may want to compare multiple values in a report broken by the same report. You can click on the green plus button by each one of them and select the breakdown report. To save you a little bit of time you have the option to use the CTRL key to select several values and then click on the green button next to one of the values and select your breakdown report.
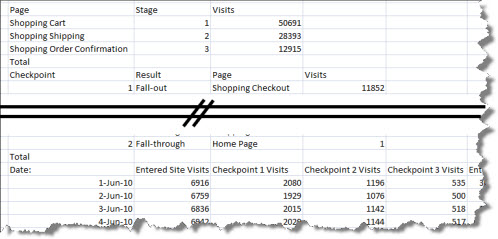
4. Copy to clipboard
How many of you have been wishing and waiting for trended fall-out data? Well, if you have Discover it is already here. I think this is one of those features that people don’t notice or forget, which is why I wanted to take the time to cover it today.
Within the Discover interface you get a view of what the trend looks like with the spark line next to the conversion number. If you would like the raw data it is as simple as opening up Excel, flipping back to Discover, clicking the Copy to Clipboard button and pasting in Excel.
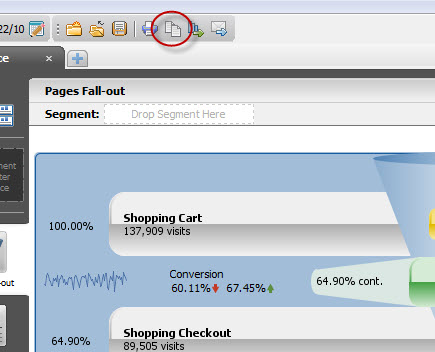
You will notice a lot of data when you paste the fall-out report into Excel. The first section includes the definitions of what each checkpoint is defined as. The second section shows the totals for the top next pages from the checkpoint when visitors fall-out (do not eventually make it to the next checkpoint) or fall-through (continue on to the next checkpoint). The third section is where you will find the trended data for the fall-out, including the percent of traffic that continues on to each step/checkpoint.
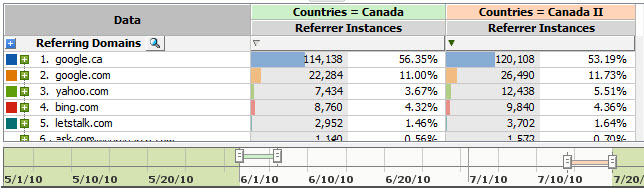
5. Comparing the same segment over time
Sometimes my analysis starts with questions like, “Why was there a big jump in visitors from Canada to my website?” This analysis requires me to compare the same segment for two different time periods, which is super easy to do in Discover. Just create your segment and once it is saved you can drag it over to the report twice, so that you have two instances of the same segment in the report. Then at the bottom of the report you will notice you now have two lines on the time range, one for each segment. Use the handles at each of the time line to select the two time periods you want to compare. Because the segments are different sizes I like to look at the percent of total instances each line item represents. As in the screen shot below you may notice that a significantly greater percent of traffic came from one referral source, like in this case “yahoo.com” (5.51% vs. 3.67%).
You might be surprised to know that some of these little golden nuggets and more can be found in the Discover User Guide (go to Help > Documentation within SiteCatalyst). I can hear the groans now, you probably dislike reading manuals as much as I do, but I promise you, this one is well worth your time and will allow you to use Discover more effectively, so I encourage you to read through it and create yourself a little cheat sheet of the golden nuggets you find.
These are some great tips. I’m glad to see a blog dedicated to Discover. Keep it coming!
Thanks for the top tips. I knew some, but the others are a nice add-on. Everybody loves shortcuts.